Guide to Setting Up a MCP Server/Client (SSE Protocol)#
This guide is inspired by
- Step-by-Step Guide: Building an MCP Server using Python-SDK, AlphaVantage & Claude AI
- Model Context Protocol (MCP) lab
The blog is using
stdiofor communication, but we will useServer Sent Events (SSE)for remote communication.
Requirements#
| Requirement | Description |
|---|---|
| Docker | Containerization platform |
| Python | >=3.11 |
| Ollama | LLM inference service |
| Model Name | qwq:32b-q8_0 |
MCP SSE Server Connection#
-
Extension:
clineorcontinue -
Docker host
cline configuration#
- Add MCP server in
cline
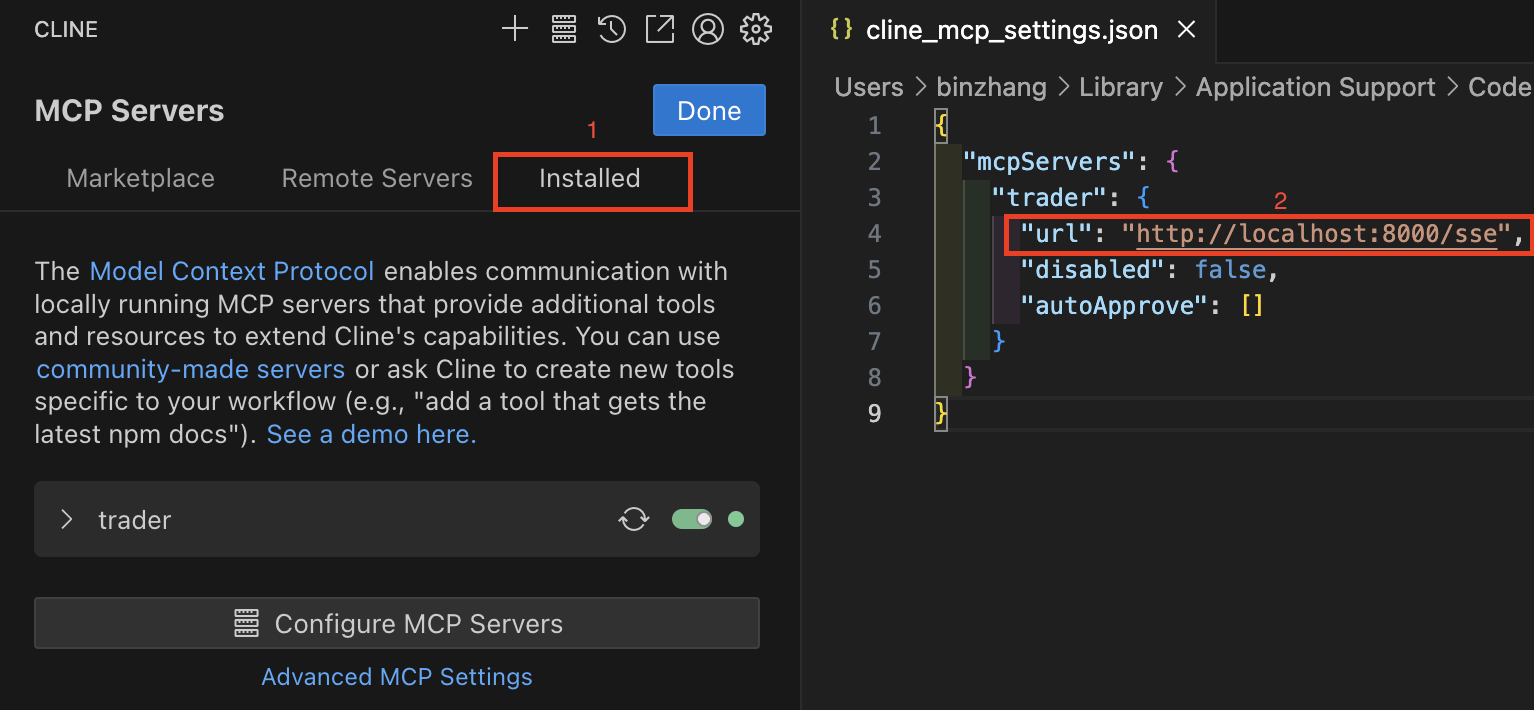
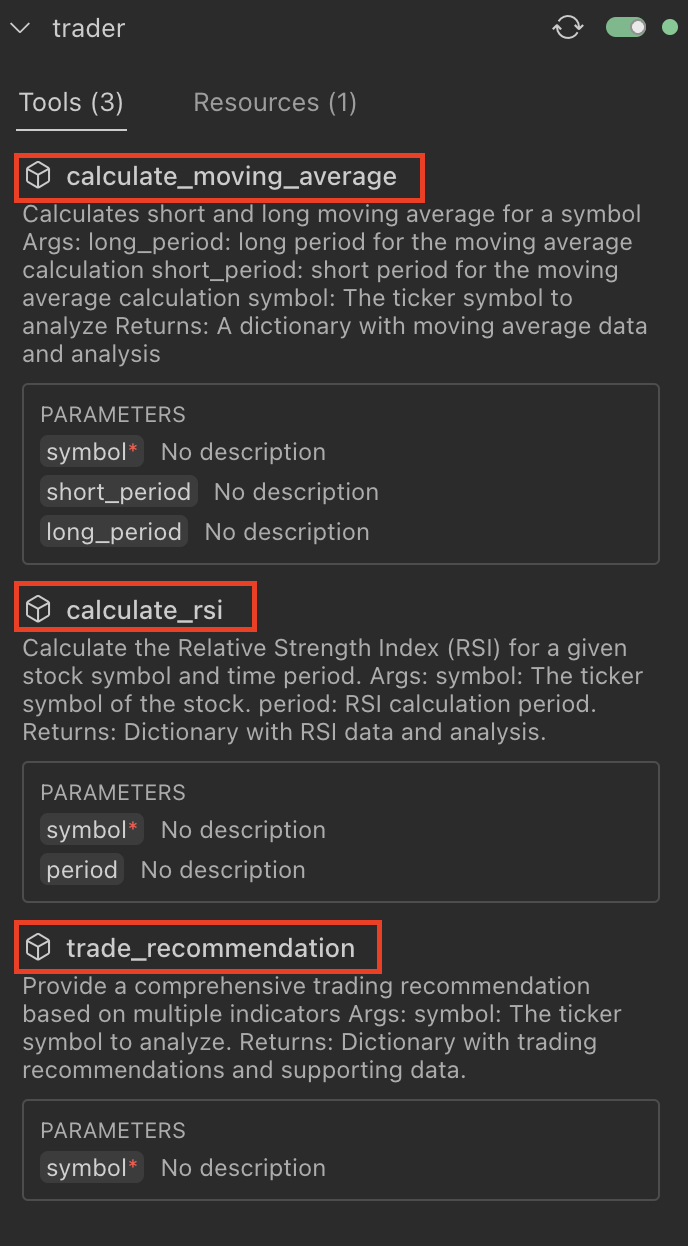
- Verify MCP tools
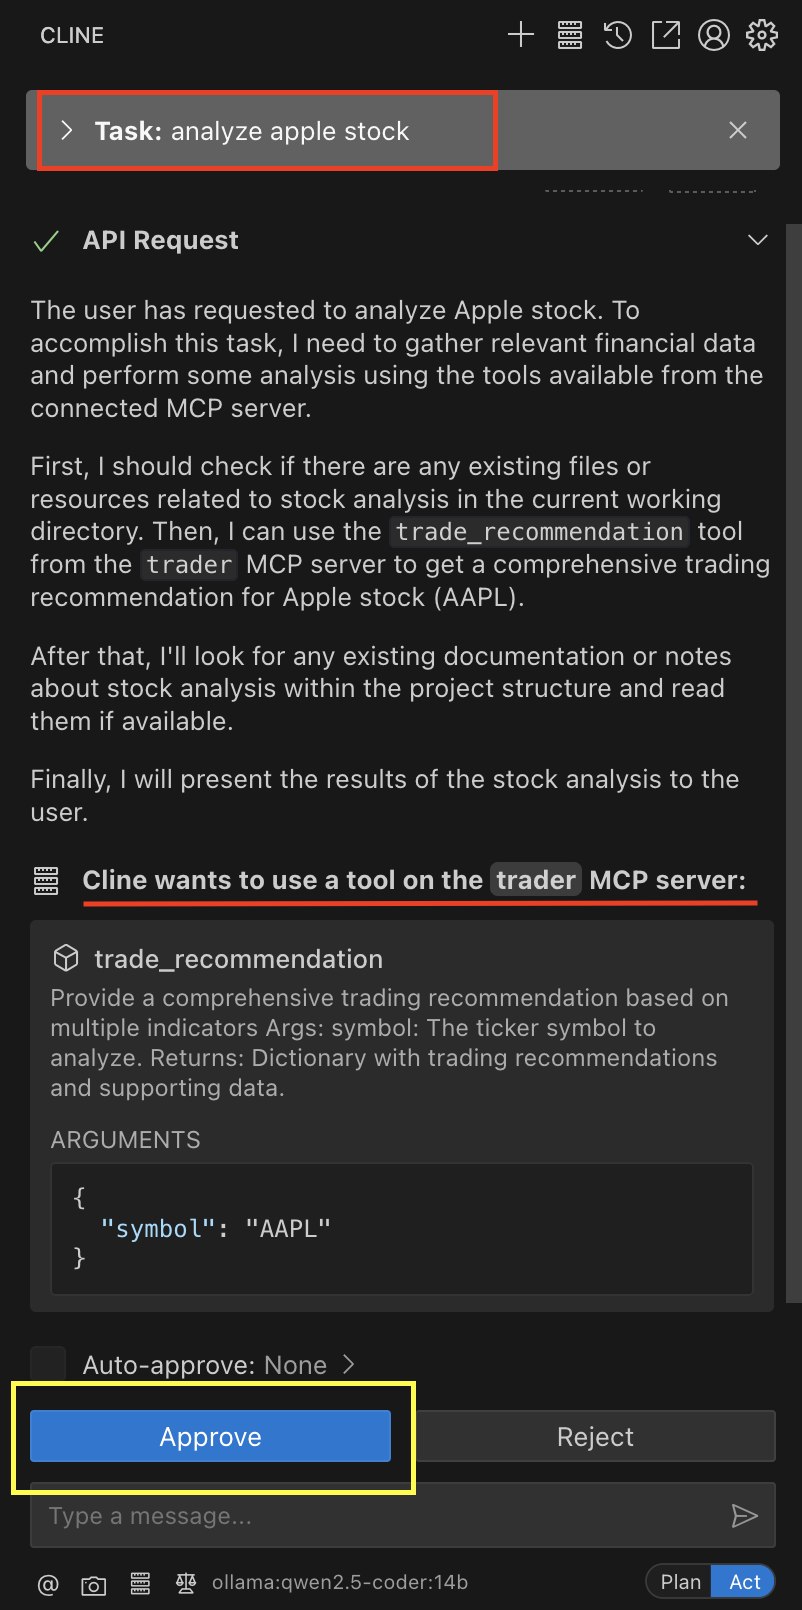
- submit one question and
clinewill ask for the approval of calling tool
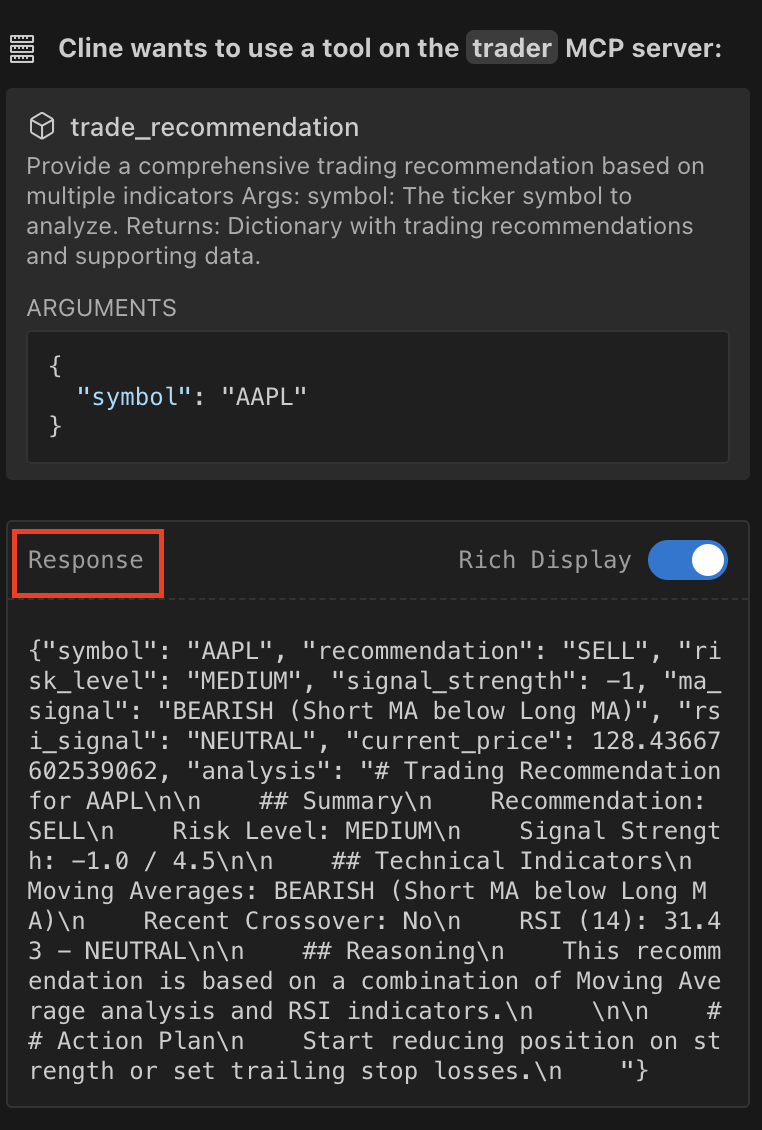
- After approval,
clinewill call the MCP server and get the response
MCP client#
Beside the vscode extension hosts like (cline, continue), you can write your own client to connect to the MCP server. The client should be able to send and receive messages using Server Sent Events (SSE). Here is a simple example in Python:
Example of python client#
-
runbelow command to start the clientpython mcp_sse_client.py http://localhost:8000/sse Initialized SSE client... Listing tools... Connected to server with tools: ['calculate_moving_average', 'calculate_rsi', 'trade_recommendation'] MCP Client Started! Type your queries or 'quit' to exit. # Input your query here, for example: Query: analyze google stock -
After inputting the query, you will get the response from the server. The response will be in JSON format.
#################################################################
# This is the first response from the server,
# which evaluates the query and determines which tools to use.
#################################################################
Tool trade_recommendation return: {"symbol": "GOOG", "recommendation": "SELL", "risk_level": "MEDIUM", "signal_strength": -1, "ma_signal": "BEARISH (Short MA below Long MA)",
"rsi_signal": "NEUTRAL", "current_price": 88.31172180175781, "analysis": "# Trading Recommendation for GOOG\n\n    ## Summary\n    Recommendation: SELL\n    Risk Level: MEDIUM\n
Signal Strength: -1.0 / 4.5\n\n    ## Technical Indicators\n    Moving Averages: BEARISH (Short MA below Long MA)\n    Recent Crossover: No\n    RSI (14): 39.25 - NEUTRAL\n\n    ##
Reasoning\n    This recommendation is based on a combination of Moving Average analysis and RSI indicators.\n    \n\n    ## Action Plan\n    Start reducing position on strength or
set trailing stop losses.\n    "}
messages
[
    {'role': 'user', 'content': 'analyze google stock'},
    {
        'role': 'assistant',
        'content': None,
        'tool_calls': [ChatCompletionMessageToolCall(id='call_0xaboll8', function=Function(arguments='{"symbol":"GOOG"}', name='trade_recommendation'), type='function', index=0)]
    },
    {
        'role': 'tool',
        'tool_call_id': 'call_0xaboll8',
        'content': '{"symbol": "GOOG", "recommendation": "SELL", "risk_level": "MEDIUM", "signal_strength": -1, "ma_signal": "BEARISH (Short MA below Long MA)", "rsi_signal":
"NEUTRAL", "current_price": 88.31172180175781, "analysis": "# Trading Recommendation for GOOG\\n\\n    ## Summary\\n    Recommendation: SELL\\n    Risk Level: MEDIUM\\n    Signal
Strength: -1.0 / 4.5\\n\\n    ## Technical Indicators\\n    Moving Averages: BEARISH (Short MA below Long MA)\\n    Recent Crossover: No\\n    RSI (14): 39.25 - NEUTRAL\\n\\n    ##
Reasoning\\n    This recommendation is based on a combination of Moving Average analysis and RSI indicators.\\n    \\n\\n    ## Action Plan\\n    Start reducing position on
strength or set trailing stop losses.\\n    "}'
    }
]

#################################################################
# This is the seconde response from the server,
# which give your final response after tools execution.
#################################################################


[Calling tool trade_recommendation with args {'symbol': 'GOOG'}]
<think>
Okay, so the user asked me to analyze Google's stock, which is symbol GOOG. I used the trade_recommendation tool with the symbol GOOG, and got back the response. Let me break this
down.

First, the recommendation is to SELL with a MEDIUM risk level. The signal strength is -1, which is on the bearish side. The MA signal is BEARISH because the short-term moving
average is below the long-term one. That usually means the trend is downwards. The RSI is 39.25, which is below 50, so it's neutral but leaning bearish. The current price is around
$88.31.

Hmm, I need to explain this in a user-friendly way. The user might be an investor looking to make a decision. They might want to know why the SELL recommendation, so I should
explain the MA crossover and RSI. Since the MA is bearish, that's a key point. RSI being neutral but in the lower range might indicate oversold, but not yet? Wait, RSI below 30 is
oversold, but 39 is still below 50, which is neutral. Maybe the user isn't familiar with these terms, so I should define them briefly.

Also, the action plan suggests reducing positions or setting trailing stops. I should mention that as a strategy. The risk level is medium, so maybe there's some caution here. The
signal strength is -1 out of 4.5, but I need to clarify what that scale means. Maybe the tool's documentation says that -4.5 to +4.5 is the range, with negative being bearish. The
user might need to know that context.

I should structure the answer clearly: summary, indicators explanation, reasoning, and action steps. Make sure it's easy to follow. Also, note any assumptions, like that the
technical indicators are based on current data. Maybe mention that past performance isn't indicative of future results to cover bases.

Wait, the RSI is 39.25, which is actually below 40. Some strategies might see that as oversold, but the tool categorized it as neutral. Maybe the tool's thresholds are different. I
should stick to the tool's signals as provided. The user might be confused if I add my own interpretation, so better to relay the tool's analysis.

Check if there's any missing info, like time frames for the moving averages or RSI period (which is 14 as per the data). Including that adds clarity. Also, the current price is
precise, so I can present that clearly.

Make sure the explanation links the indicators to the recommendation. Since MA is bearish and RSI neutral, the recommendation is based on the MA trend. The action plan aligns with
a cautious approach in a bearish trend. Highlight the key points in bold or bullet points for readability. Keep it concise but informative.
</think>

Here's the analysis of **GOOG (Alphabet Inc.)** based on the provided technical indicators:

---

### **Trading Recommendation Summary**
- **Symbol**: GOOG
- **Recommendation**: **SELL**
- **Risk Level**: **MEDIUM**
- **Signal Strength**: **-1.0/4.5** (Bearish)
- **Current Price**: $88.31

---

### **Key Technical Indicators**
1. **Moving Averages (MA)**
   - **Signal**: **BEARISH**
   - **Reason**: Short-term MA (e.g., 50-day) is **below** the long-term MA (e.g., 200-day). This suggests a weakening upward trend or a potential downtrend.
   - **Recent Crossover**: No recent crossover detected (e.g., "death cross" or "golden cross").

2. **RSI (14-period)**
   - **Value**: 39.25
   - **Signal**: **NEUTRAL**
   - **Interpretation**: The RSI is below 50, indicating bearish momentum, but not yet in oversold territory (typically < 30). This suggests consolidation rather than extreme
undervaluation.

---

### **Reasoning Behind the Recommendation**
- The **MA bearish signal** is the primary driver for the "SELL" recommendation. A sustained short-term MA below the long-term MA often signals a shift to a bearish trend.
- While the **RSI is neutral**, it supports the bearish sentiment by showing downward momentum but not overextended selling.
- The **signal strength of -1.0/4.5** reflects moderate bearishness, combining both MA and RSI inputs.

---

### **Action Plan**
- **Short-Term Traders**: Consider reducing positions or booking profits if prices rebound.
- **Risk Management**: Set **trailing stop-losses** (e.g., 5-10% below recent support levels) to protect gains.
- **Monitor**: Watch for a reversal if the short-term MA crosses **above** the long-term MA or if RSI moves into oversold territory (< 30).

---

### **Risk Considerations**
- **Medium Risk**: The bearish MA crossover suggests a cautious stance, but the RSI not being oversold implies potential further downside.
- **Uncertainties**: External factors (e.g., earnings reports, macroeconomic trends, tech-sector news) could influence the trend unexpectedly.

---

### **Next Steps**
- Reassess in 1–2 weeks for potential crossover signals or changes in momentum.
- Track support levels (e.g., $85–$87) for possible bounce opportunities.

Let me know if you want further details or a deeper dive into specific indicators! 📈